
May 2024 Housing Market Outlook for Sale by Owner
Housing market for sale
I-Sales price analysis
The decline in real housing prices continues
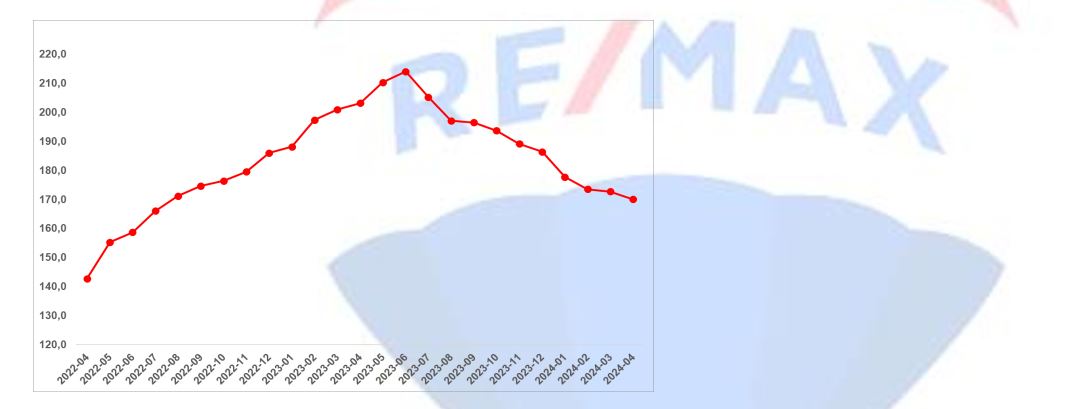
The decline in the countrywide real housing price index (2017=100), which has been increasing continuously since May 2020, continued in April 2024 as well (Figure 1). The real house price index decreased by 2.7 points in April compared to March, reaching 170. While the inflation rate from March to April was approximately 3.2 percent, the current house price increase throughout Turkey remained at 1.6 percent in the same period. Real prices have been decreasing as current house prices have systematically remained below inflation in recent months.
Figure 1: Real housing price index across Turkey (2017 Sepül=100)
Source: sahibinden.com, Betam
The decrease in the real sales price is threefold. continues in metropolitan cities as well
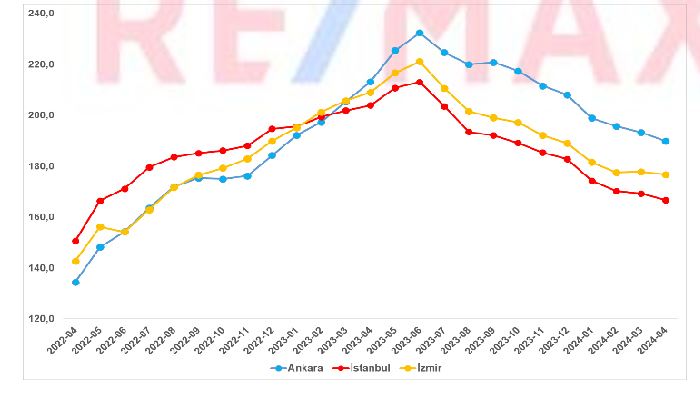
As in the previous eight months, the real sales price of housing decreased by three months. It also decreased in the metropolitan city in April (Figure 2). From March to April, real house prices decreased by 2.6 points in Istanbul, 3.4 points in Ankara and 1.1 points in Izmir. In April, the real housing price index (September 2017=100) was 166.7 in Istanbul, 189.9 in Ankara and 176.8 in Izmir.
Figure 2: Three Real sale prices in major cities (2017 Sepül=100)
Source: sahibinden.com, Betam
Annual change in real prices continues to be negative
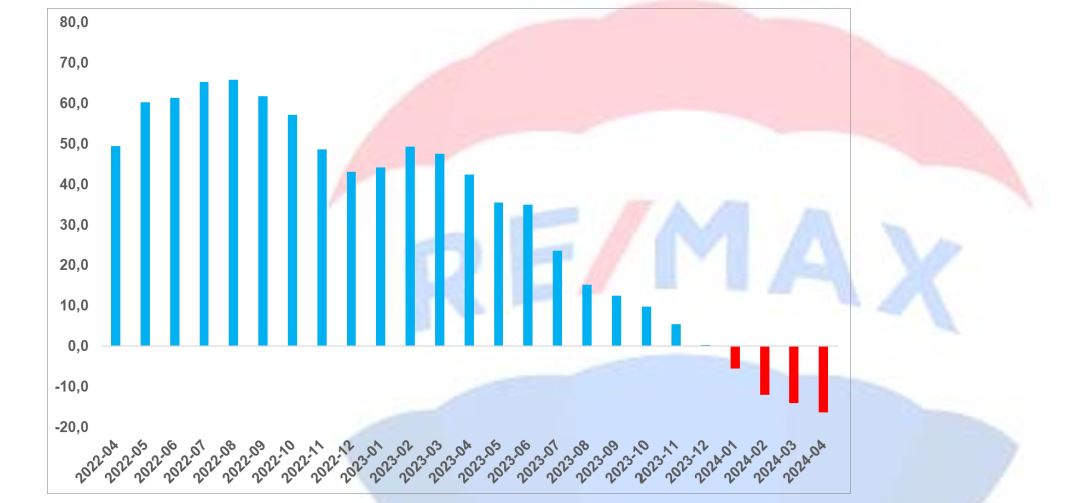
Figure 3 shows the annual change rate of inflation-adjusted (real) prices of houses for sale across Turkey. The annual real price increase, which reached 65.8 percent in August 2022, has started to decline rapidly as of September 2022. The annual real price, which rose temporarily in February 2023 due to the impact of the major earthquake, started to decrease again as of March, and in April 2024, the annual price change rate decreased by 2.2 points compared to March 2024, reaching -16 percent. its course at negative values between .3 and continued. As a reminder, the negative annual change in real prices shows that inflation is increasing faster than housing prices. This situation shows that purchasing a house for investment purposes will no longer be attractive as of January 2024.
Figure 3: Annual change in real prices of houses for sale across Turkey (%)
Source: sahibinden.com, Betam
The decline in the annual real price increase is threefold. It is also seen in big cities
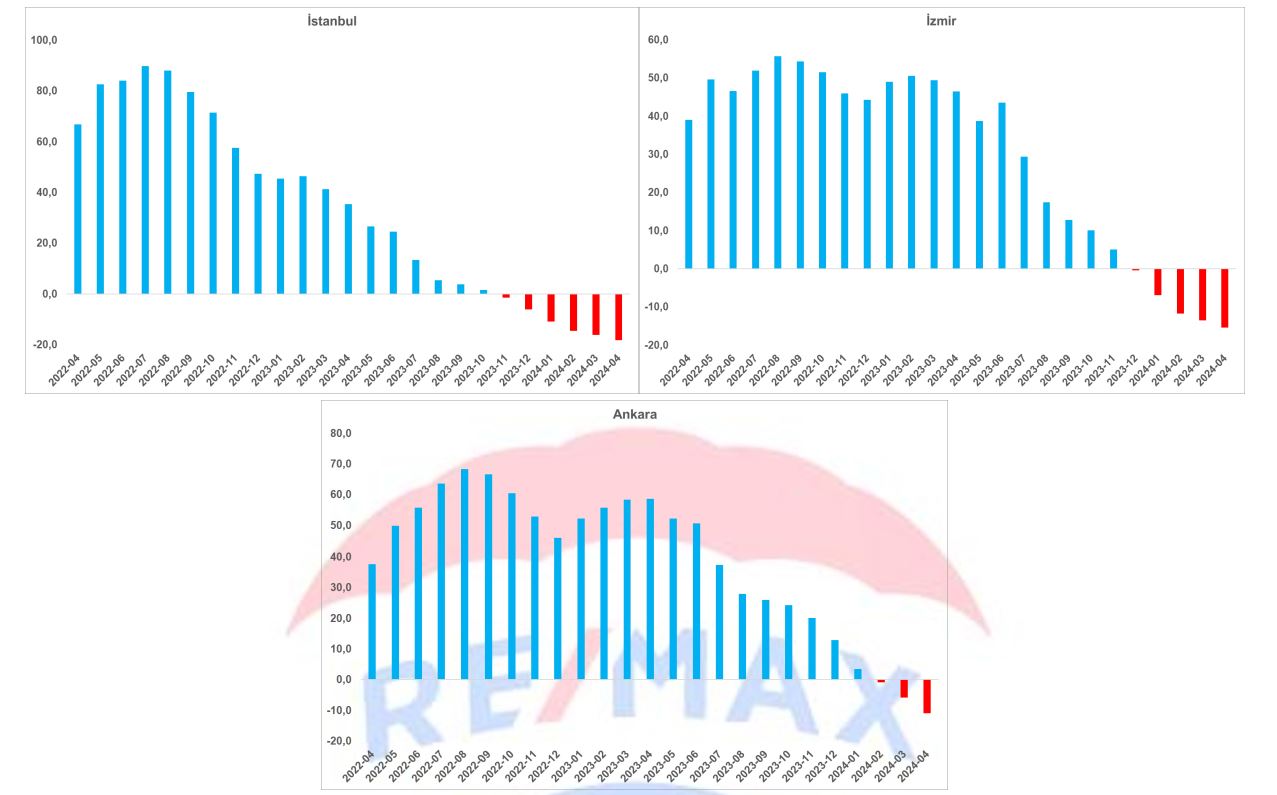
As is the case throughout the country, annual increases in real sales prices are three percent. It also decreased rapidly in metropolitan cities in the same period (Figure 4). The most striking decrease occurred in Istanbul. The annual real price increase, which peaked at 89.8 percent in July 2022, decreased to -18.3 percent as of April 2024, as a result of a very sharp decline. In other words, the average housing in Istanbul has become cheaper in real terms compared to a year ago. After the peak of 55.6 percent in August 2022 in Izmir, annual real price increases began to decrease at a moderate pace, with a sharp decline starting from July 2023 and -15.4 percent in April 2024. It has decreased to .
It is seen that annual real prices in Ankara follow a slightly different course than in Istanbul and Izmir. Annual price increases started to decline after the 68.3 percent peak reached in August 2022, but the annual price change started to rise in January 2023, and with the effect of the February 6 earthquake, the rise continued until April. As of July, there has been a great loss of pace in annual real price increases in Ankara. In April 2024, the annual real price change was -10.9 percent in this city, with a rapid decline.
Figure 4: Three Annual change in real prices of houses for sale in major cities (%)
Source: sahibinden.com, Betam
The increase in current prices is slowing down
From March to April, the increase in the average price of houses for sale in Turkey was 1.6 percent, and the m2 price increased from 27,816 TL to 28,257 TL. The rate of increase in current prices was 1.6 percent in Istanbul, 1.4 percent in Ankara and 2.6 percent in Izmir. As of April 2024, the average house price per m2 is 39,080 TL in Istanbul, 21,250 TL in Ankara and 32,632 TL in Izmir.
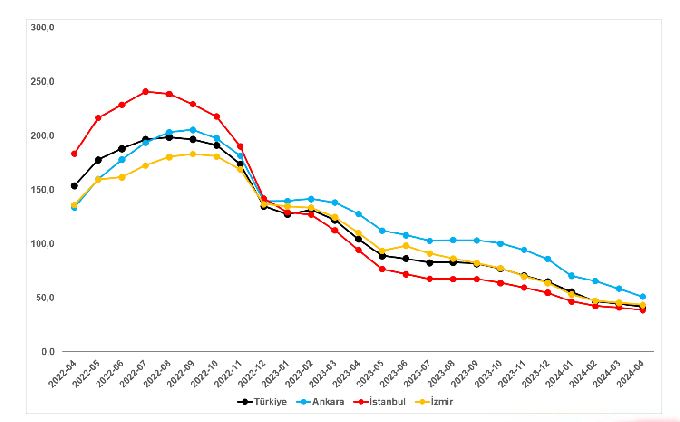
There has been a clear slowdown in the year-to-year increase in current prices over the last year (Figure 5). Annual house price change peaked across Turkey in August 2022 with an increase of 198.7 percent. Although house prices continued to increase due to inflation in the following months, there was a clear slowdown in the pace of increase. The annual increase rate of the average house in the country at the current price is 42.1 percent as of April 2024.
The loss of tempo in the annual increases of current prices is threefold. It is also valid for big cities. After reaching the peak (240.9 percent) in Istanbul in July 2022, the decline started and the annual price increase decreased to 38.8 percent in April 2024. In Ankara and Izmir, the peak was reached in September 2022 (205.6 percent and 183.1 percent), and in April 2024, the annual increase rates in these two provinces were 51.3 percent, respectively. e and percent It decreased to 43.6 (Figure 5).
Figure 5: Turkey and Turkey Annual change in housing listing prices for sale in major cities (%)
Source: sahibinden.com, Betam
Difference in housing sales price increases in metropolitan cities
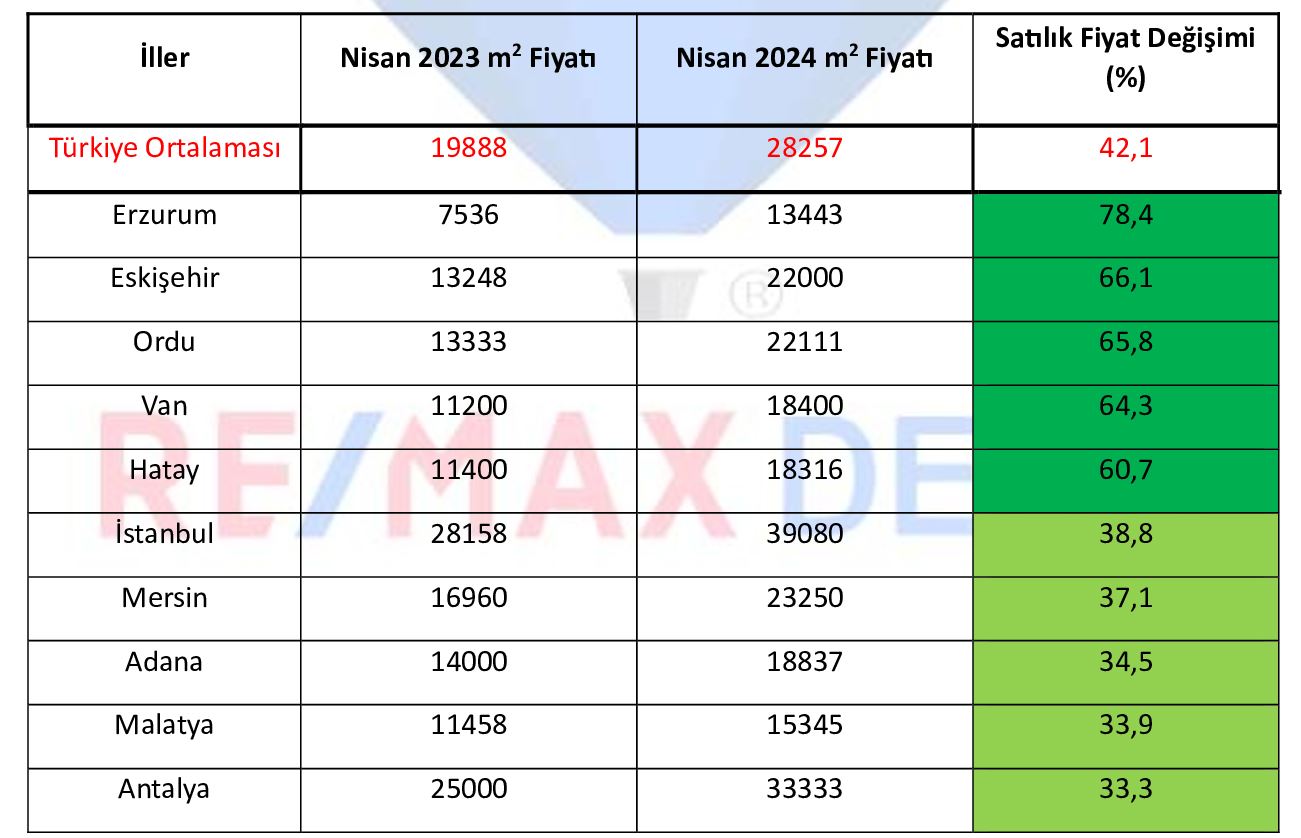
Table 1 shows the highest and lowest annual changes in advertising sales prices measured at the metropolitan level. Advertisement sales prices increased in all major cities in April 2024 compared to the same month of the previous year. It is the region where the fastest increase in residential m2 prices for sale is seen. The provinces are: Erzurum (78.4 percent), Eskişehir (66.1 percent), Ordu (65.8 percent), Van (64.3 percent) and Hatay (60 percent). ,7). The places where the lowest increases were seen The provinces are Istanbul (38.8 percent), Mersin (37.1 percent), Adana (34.5 percent), Malatya (33.9 percent) and Antalya (33.3 percent). ) has happened.
Table 1: Provinces with the highest and lowest annual for sale ad price changes – April 2024
Source: sahibinden.com, Betam
Decline in housing supply
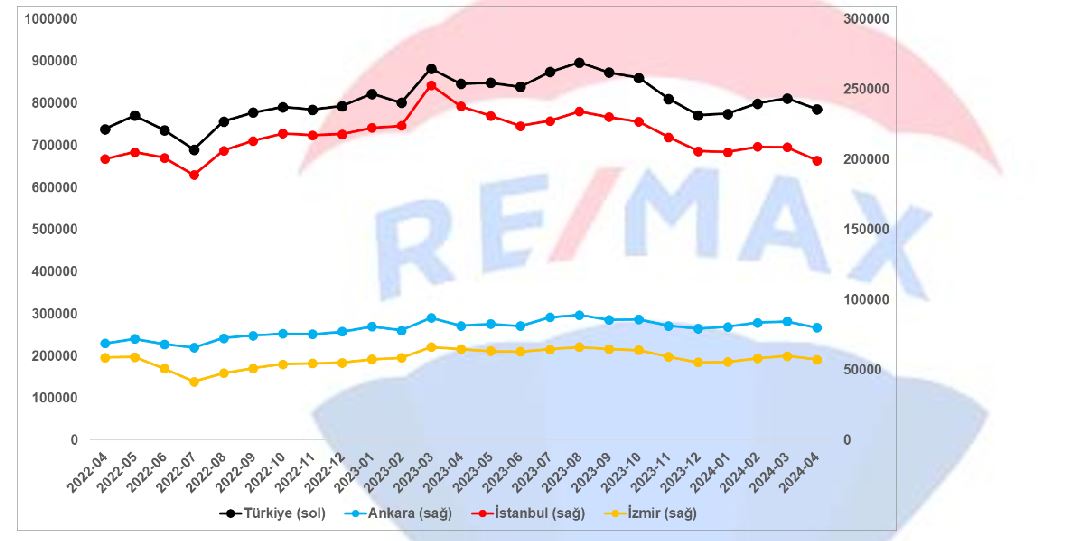
Figure 6 across the country and in three The size of the supply of housing for sale in a metropolitan city. It shows the course of the number of for sale ads that we use. The number of housing advertisements for sale is three-thirds across the country. It decreased in metropolitan cities. Compared to last month, the supply of housing for sale increased by 3.1 percent across the country (from 811,548 to 786,040), by 4.5 percent in Istanbul (from 208,714 to 199,340), and by 4.5 percent in Ankara. ;in It decreased by 5.1 percent (from 84,672 to 80,316) and by 4 percent (from 59,982 to 57,558) in Izmir.
Figure 6: Turkey and Turkey Number of ads for sale in major cities (piece)
Source: sahibinden.com, Betam
Slowdown in housing demand
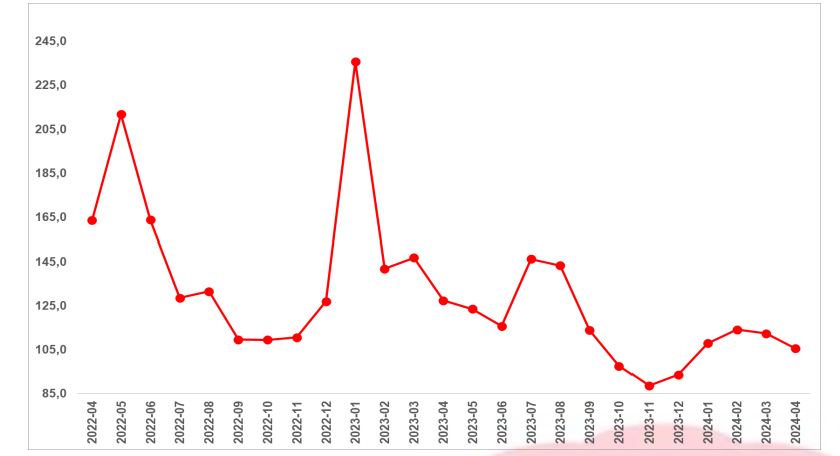
Figure 7 shows the course of housing demand across the country. The housing demand indicator was created by combining 6 different data. These data; Number of views of advertisements, number of times advertisements were added to favorites, total number of messages sent to advertisers, total number of phone calls made through sahibinden.com application, for sale on sahibinden.com mobile and web platforms obtained from Google Analytics. It consists of the number of users and page views for the real estate category and the relevant month.
While creating the housing demand indicator, each of the values of these series in February 2020 was equalized to 100, and the values in other months were calculated by proportioning accordingly. Then, the weighted average of these indicators was taken and the value of the new demand indicator in the relevant month was calculated. While the value of 100 of this indicator indicates the housing demand in February 20201, a rise in this indicator indicates that the demand increased compared to February 2020, and a decrease indicates that the housing demand decreased.
1Arama sayılarına ait veri 2020 Şubat ayından itibaren mevcut olduğundan talep göstergesi bu tarihten sonraki dönemde hesaplanmıştır.
Figure 7: Demand indicator (February 2020=100)
Source: sahibinden.com, Betam
Housing demand, which showed a very sharp decline after the earthquake in February 2023, decreased until November after the increase in July. Housing demand started to increase in December, and decreased by 1.6 percent in March compared to February, reaching 112.4. In April, the downward trend in March continued and the housing demand indicator decreased by 6 percent and reached 105.6. Housing demand is 17.1 percent lower than in April last year.
Both the housing supply and the number of houses sold have decreased throughout Turkey.
Figure 8- left panel shows the ratio of the number of houses sold to the number of ads for sale2, which shows how much of the ads for sale were sold. An increase in this ratio means that the interest per advertisement increases. The ratio of the number of houses sold to the total number of advertisements for sale decreased by 0.6 points in April compared to March and became 3.4 percent.
When we look at the background of the monthly change in the ratio of the number of houses sold to the total number of advertisements for sale, we see that both the number of advertisements for sale and the number of houses sold have decreased. can be seen (Figure 8 - right panel). In April 2024, compared to March 2024, the number of listings for sale increased by 3.1 percent (from 811,548 to 786,040), and the number of houses sold increased by 17.9 percent (from 32,685 to 26,834). decreased by .
Şekil 8: Türkiye genelinde satılan konut sayısının satılık konut ilan sayısına oranı (%) (Sol panel), satılan ve satılık konut sayısı (Bin adet) (Sağ panel)
Source: sahibinden.com, Betam
The decrease in the ratio of the number of houses sold to the number of houses listed for sale in three major cities
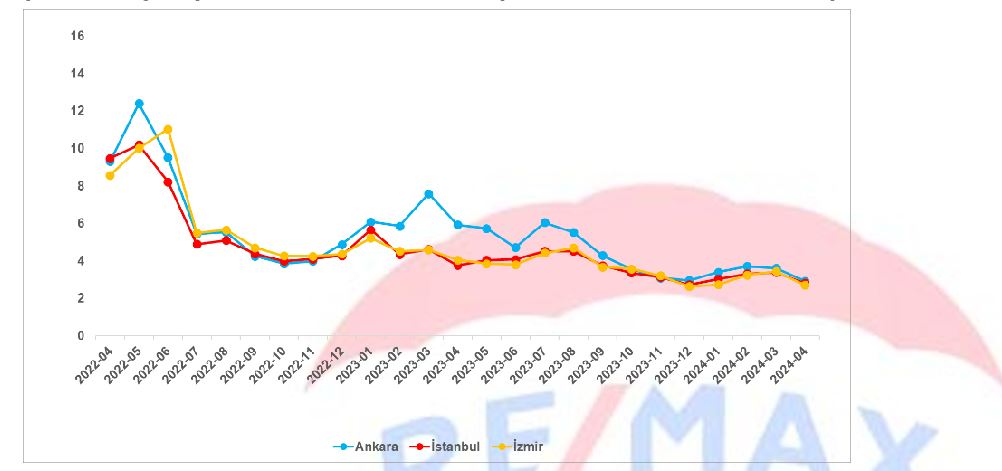
The ratio of sold houses to the total number of sale advertisements decreased by 0.7 points in Ankara, 0.6 points in Istanbul and 0.7 points in Izmir compared to the previous month (Figure 9). According to April data, the ratio of sold houses to the total number of sale advertisements was 2.9 percent in Ankara, 2.8 percent in Istanbul and 2.7 percent in Izmir.
Figure 9: Three Ratio of the number of houses sold in the largest city to the number of house advertisements for sale (%)
Source: sahibinden.com, Betam
Decrease in the number of houses sold and the number of advertisements
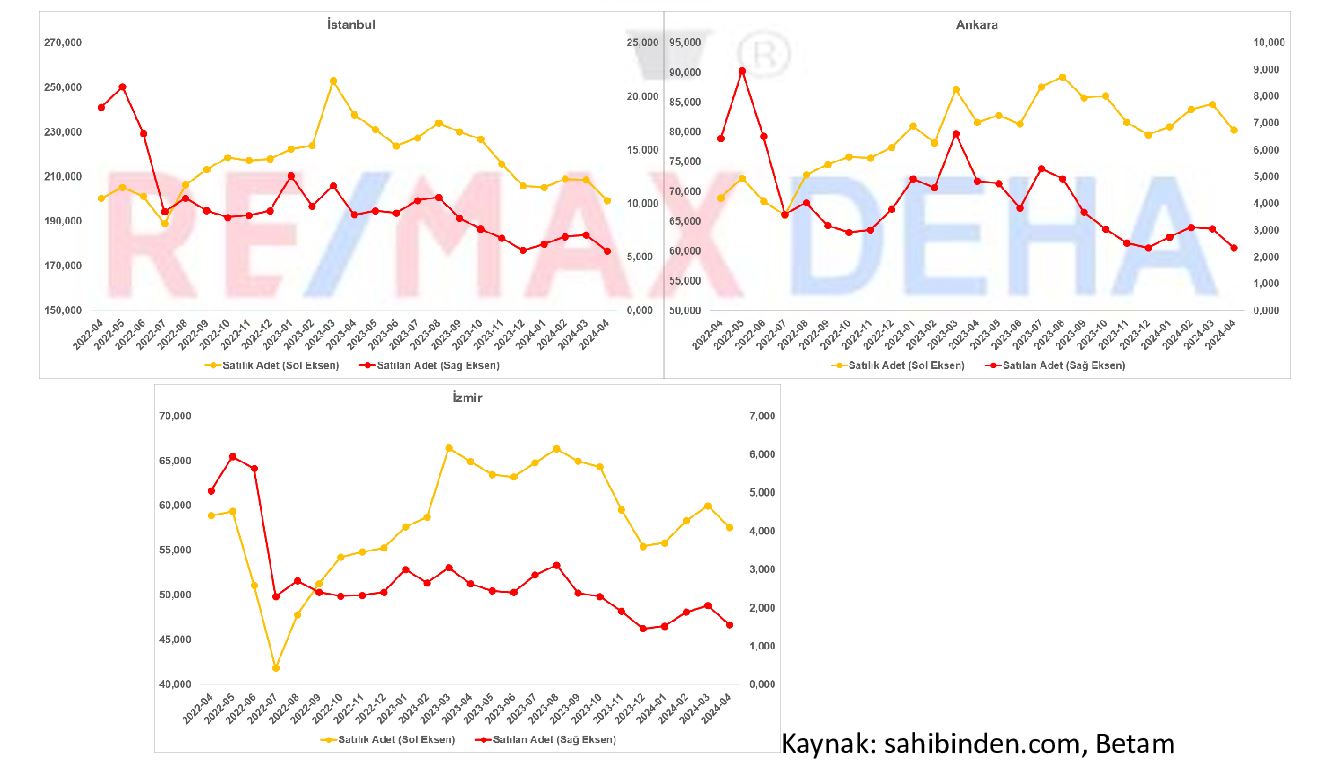
Figure 10 three It shows the number of housing advertisements for sale and the number of houses sold in the major city. The number of houses for sale is three;ç It has also decreased in major provinces. Compared to last month, the number of houses for sale increased by 4.5 percent in Istanbul (from 208,714 to 199,340), and by 5.1 percent in Ankara (from 84,672 to 80,316). ), in Izmir It decreased by 4 percent (from 59,982 to 57,558). The number of houses sold also tripled. It has fallen in most major provinces. Compared to the previous month, houses sold increased by 21.1 percent in Istanbul (from 7,072 to 5,583), and by 23.3 percent in Ankara (from 3,060 to 2,346). ), in Izmir It is less than 24.4 percent (from 2,062 to 1,560).
Figure 10: Three Number of houses sold and for sale in the largest city (Thousand units)

The age of closed advertisements of houses for sale is both in the country and within three years. increased in metropolitan cities
House for sale closed advertisement age3 sums the duration of the live house advertisements closed by the user in the relevant month and divides it by the number of unique advertisements closed by the user in that month. Therefore, this number is the average number of an advertisement. It shows that it has been on air for days. The age at which a house for sale is closed is another measure of how easy or difficult it is for the houses to be sold to be sold. It should be considered as. An increase in this indicator indicates that houses are advertised for a longer time and are sold more difficult or slower, while the opposite indicates that houses are sold easier or faster.
The age of closed advertisements is three years across the country. It increased in most provinces (Figure 11). Compared to March, the closed advertisement age has increased by 4.1 days across the country, by 4.2 days in Istanbul, by 2 days in Ankara and by 5 days in Izmir. According to the latest data, the age of closed advertisements was 72.7 days across the country, 78.1 days in Istanbul, 56.4 days in Ankara and 85.9 days in Izmir.
Figure 11: Throughout Turkey and in three Age of closed advertisement of houses for sale in the largest city (Days)

Source: sahibinden.com, Betam
Difference in the age of closed advertisements in big cities
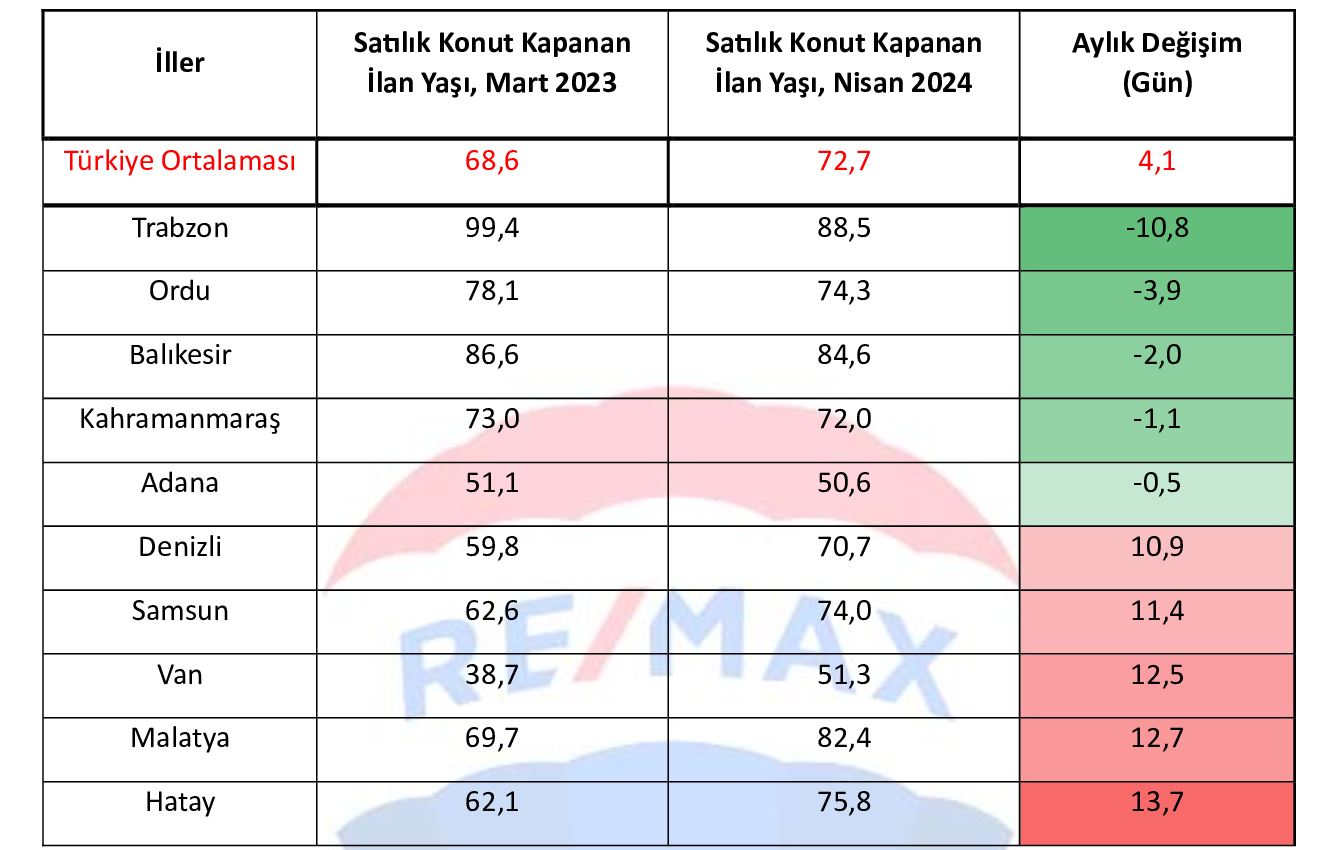
Table 2 shows the 10 provinces with the highest change in the age of closed advertisements. The provinces where the age of closed advertisements decreased the most were Trabzon (10.8 days), Ordu (3.9 days), Balıkesir (2 days), Kahramanmaraş (1.1 days) and Adana (0 .5 days), the provinces where it increased the most were Denizli (10.9 days). Samsun (11.4 days), Van (12.5 days), Malatya (12.7 days) and Hatay (13.7 days).
Table 2: Provinces with the lowest and highest increase in the age of closed listings of houses for sale compared to the previous month – April 2024
Source: sahibinden.com, Betam


 I Want to Sell/Rent My Property
 Looking for a Property for Sale/Rent
 I Want Portfolio/Buyer Referral Business Partnership
 Call Now